Manufacturing KPIs: How to Determine the Most Important Ones
Manufacturing is a data intensive business and the best companies use all the information at their disposal to plan their work and work their plan. That plan, better described as their strategy, relies on setting targets or goals and measuring the organizational contributions from all corners of the business to manage progress toward attaining those goals. Those organizational contributions are referred to as manufacturing key performance indicators (KPIs) and become the telemetry that a manufacturer uses to know how they are performing at any given time.
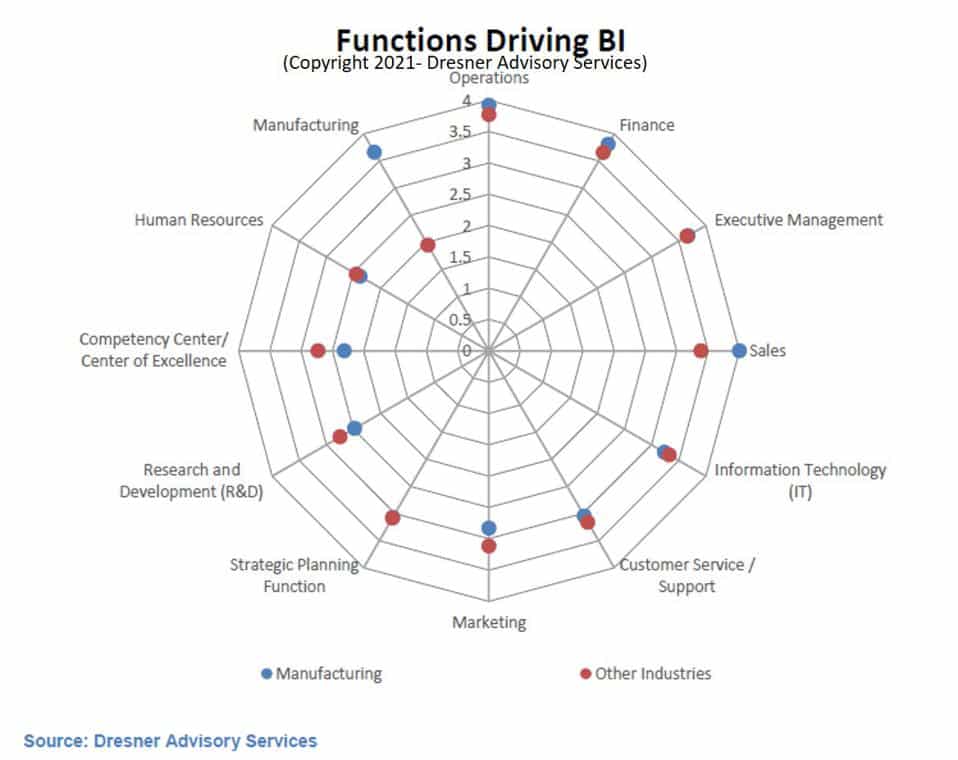
The monitoring and measurement of these KPIs have been a key driver of industry 4.0 and the transition to IIoT (Industrial Internet of Things) and smart manufacturing taking place across the industry. In a recent survey cited by Forbes, nearly half of manufacturers reported an increase to their BI and analytics budgets, with 62% saying “self-service BI was essential to their business.”
What are Manufacturing KPIs?
Manufacturing KPIs are metrics used to track the performance of a manufacturing enterprise. Recording and monitoring these key performance indicators can provide real-time visibility and insight into business success, opportunities to improve performance, and support bottom-line growth. They can be reported through various mechanisms, but the preferred approach is the use of business intelligence (BI) tools and dashboards that provide easy to understand visualizations of the data.
These visualizations are typically color-coded for quick consumption, with red to indicate missing a target, yellow to signal that a goal may be at risk, or of course green to confirm that the underlying dimension is on track. These insights inform you of potential problems and where to direct your attention for maximum effectiveness. Managers and executives love dashboards so they can drill down on any red data to determine what may be causing the miss so they can attack that issue directly. It is much easier to manage what you can measure—especially if you can measure in real-time.
Manufacturing KPI Examples
The following are the top KPIs tracked by manufacturing organizations:
- Revenue
- EBITA: Earnings before interest, taxes, and amortization
- COGS: Cost of goods sold
- Inventory Turns: How long it takes to turnover inventory
- Return on Assets: Or return on invested capital such as return on investment (ROI)
Manufacturing KPIs are also categorized into groups:
- Production KPIs
- Quality KPIs
- Safety KPIs
Production KPIs
Production KPIs monitor the quantifiable metrics of a manufacturing enterprise’s production process. Because production costs are second only to the cost of inventory for a manufacturer, they are the subject of intense and continuous scrutiny. Through recording and monitoring production rates, and comparing them to projected targets, manufacturers can determine where they may be falling short and execute plans to improve them. As manufacturers complete their digital transformations and adopt more robotic and co-robotic systems and shopfloors, the importance of production metrics to overall business planning will only increase. In a recent article, Automation World predicted that once the dust settles, “one thing all industrial companies will likely have in place is advanced analytics to track operating metrics at a highly granular level.”
Production KPI Examples
Manufacturers frequently monitor the following production KPIs:
- Production volume: the total number of products produced over a select period of time
- Equipment uptime: the amount of time that various lines and operations are being utilized to produce products
- Production costs: the resource costs accrued from production such as labor or electricity
- Overall Equipment Effectiveness (OEE): a calculated % of actual production against possible production considering equipment uptime and quality parts produced
- On-time delivery: the rate to which an organization is meeting its scheduled delivery times
- Lead time: the average time it takes for a customer to receive an order after purchase or time it takes to receive raw materials from suppliers
- Inventory turnover: the frequency with which your enterprise is able to sell its entire inventory
- Stockout rate: the percentage of items that are out of stock when a customer places an order
- Capacity utilization: the rate to which maximum possible efficiency is achieved
- Unplanned downtime: the ratio of unscheduled downtime compared to scheduled maintenance
- Backlog: the amount remaining to be done, can be used in reference to an array of different factors or metrics
- Maintenance costs: expenses incurred from maintenance
- Revenue per employee: how much is being made per employee
- Profit per employee: how much is being made per employee when accounting for the cost of their wages
- Work-in-process (WIP) inventory: The total cost of unfinished goods currently in the production process
Quality KPIs in Manufacturing
Customers will only pay for products that meet their specified quality, so Note that quality performance is a component of OEE outlined above, as any rejected products get subtracted from production output. Quality is also critical to both a company’s topline revenue as it reflects their brand and the bottom line as every rejection or non-conformance results in losses of materials to scrap or time to rework.
Quality KPI Examples
Manufacturers frequently monitor the following quality KPIs:
- Defect rate: the percentage of products that were defective or unusable
- Non-conformance rate: the percentage of products that do not meet customer or industry requirements
- Customer satisfaction rate: the rate with which customers are satisfied with their product, service, or experience
- Customer complaint rate: the rate with which customers are dissatisfied with their product, service, or experience
- Return rate: the rate of shipped items returned to the enterprise
- First-pass yield: the number of units that come out of a process divided by the number that went into it
- Audit compliance: the rate of your company’s compliance with independent audits
- Audit pass rate: the rate at which your company passes independent audits
- Corrective and preventative action rate (CAPA): the rate with which actions must be taken in order to prevent future production irregularities
Safety KPIs in Manufacturing
Safety KPIs are manufacturing metrics used to drive safety behaviors of an organization’s production process as it relates to its people and operations. Production facilities can be an inherently dangerous environment and operation leaders are laser focused at protecting their employees as well as their equipment. With the rising focus on ESG metrics, health and safety KPIs now role up into the S (social) in ESG targets. Stakeholders now look at the safety of employees as it relates to the risk of the overall business.
Safety KPI Examples
Manufacturers frequently monitor the following safety KPIs:
- Injury rate: the rate at which employees got injured
- Incident rate: the rate of incidents (accidents resulting in injury or illness)
- Recordable incidents: the total number of incidents (accidents resulting in injuries)
- Lost time rate: the ratio of hours lost to injuries to total time spent working
- Compliance rate: the ratio at which employees comply to company & governmental standards
- Training completion rate: the ratio at which employees complete safety training
- Near-miss reporting rate: the rate at which near misses (incidents that do not involve property damage or injury) are reported
How to Determine the Most Important Manufacturing KPIs
The metrics that you should track, measure, and calculate into the KPIs you will run your business against depend heavily on your type of manufacturing business. For example, OEE is a very high-level measurement important to capital-intensive businesses. If you are paying for expensive machines, they had better be generating revenue as much as possible. Note that OEE is best used as a trend indicator than for absolute values. If you’re more of a manual assembly type business, you’d likely lean toward safety metrics that can help protect your assemblers.
1. Define Your Business Goals
The most important manufacturing KPIs to monitor in order to achieve your business goals can only be determined if you define these business goals in the first place. There is no limit on the amount of things that can be measured and recorded. It is only through defining what a “good performance” is that you can determine what factors indicate it. It is also critical that your employees have visibility to the KPIs that the business is using and are educated on how their contributions can influence success.
2. Review Benchmark KPIs for the Manufacturing Industry
Reviewing industry benchmarks for manufacturing KPIs can help you to determine how your company is performing against your peers (and competitors).
Benchmarks highlight discrepancies that may help illuminate where you should be directing your focus. Several manufacturing industry-wide concepts have taken the forefront over the years with Lean and Six Sigma being perhaps the most successful. Lean—or continuous improvement—focuses on the fundamental activities that may be causing waste but is also focused at adding value that the customer is willing to pay more for. Six Sigma is a rigorous statistical exercise that gets right to the heart of where your quality may be going awry and effective use results in tremendous savings on scrap or waste.
3. Understand Which Manufacturing KPIs Affect the Bottom Line the Most
At the end of the day, most KPIs are but tools to be used in pursuit of the overall goal of having a business in the first place: profit. And in the pursuit of this goal, it is important to know which factors are contributing to your overall profits and which ones are not, as well as the varying degrees to which they influence it. If a metric or KPI is found to have no influence on profits, then it is without purpose to seek its adjustment. Similarly, if a few select KPIs are found to contribute immensely and disproportionately to your company’s overall profits, then it would behoove you to monitor these metrics religiously and invest time and money in the pursuit of controlling them.
Learn More: Gaining a 360° View of Your Business
4. Consult with Key Stakeholders
Finding out all the different ways you could be cutting costs and boosting profits is difficult without comprehensive visibility and collaboration between the departments at your company. Peter Drucker is often quoted that “You can’t improve what you don’t measure.” Although this is actually a misquote, it is true that if you want to improve a process, you should measure and monitor it. This is the heart of continuous improvement. You can’t determine which production cycle, process, or method is yielding you the most return if you aren’t watching it. Managing and communicating your KPIs through dashboards in an enterprise resource planning solution (ERP) gives visibility to improvement opportunities as the data can be sliced, dices, and reported in many ways such as real-time dashboards.
Consulting with key stakeholders will save immense time so that you don’t have to back pedal later and rework all of your reporting to find the right insights. In fact, empowering your frontline workers to communicate how they would improve a process is critical. Despite all the technology you may use to collect your operational metrics that bubble up to your KPIs still requires people to make the judgements on how to improve.
Gain 360° Insights with Manufacturing KPI Dashboards
With a comprehensive and customizable access to the data that reflect the most important KPIs for your manufacturing enterprise, Rootstock on the Salesforce Platform provides a common data model that enables the data from across your enterprise to come together without complex reconciliation. In typical environments with data silos and spreadsheets, the data must be manipulated and transposed and reporting comes too late to be effective.
Leverage the power of Salesforce and Rootstock to create Manufacturing KPI Dashboards
Learn more about Rootstock’s Analytics & Business Intelligence features by visiting our product page and watching a webinette about this feature.